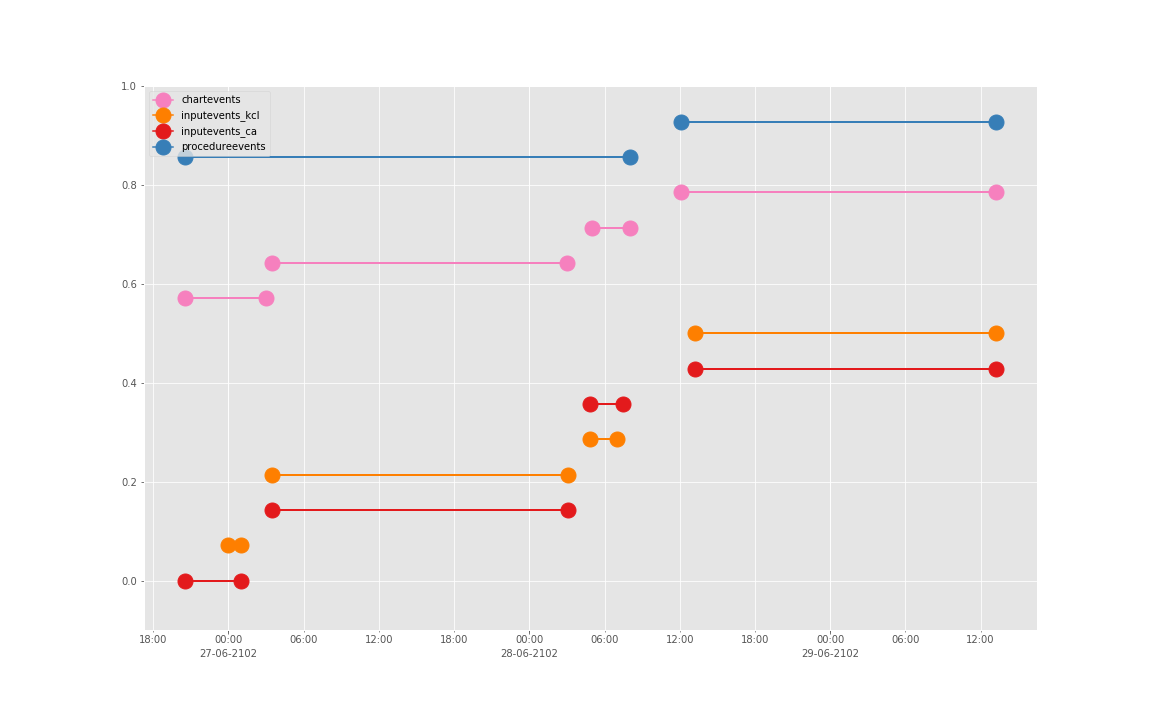
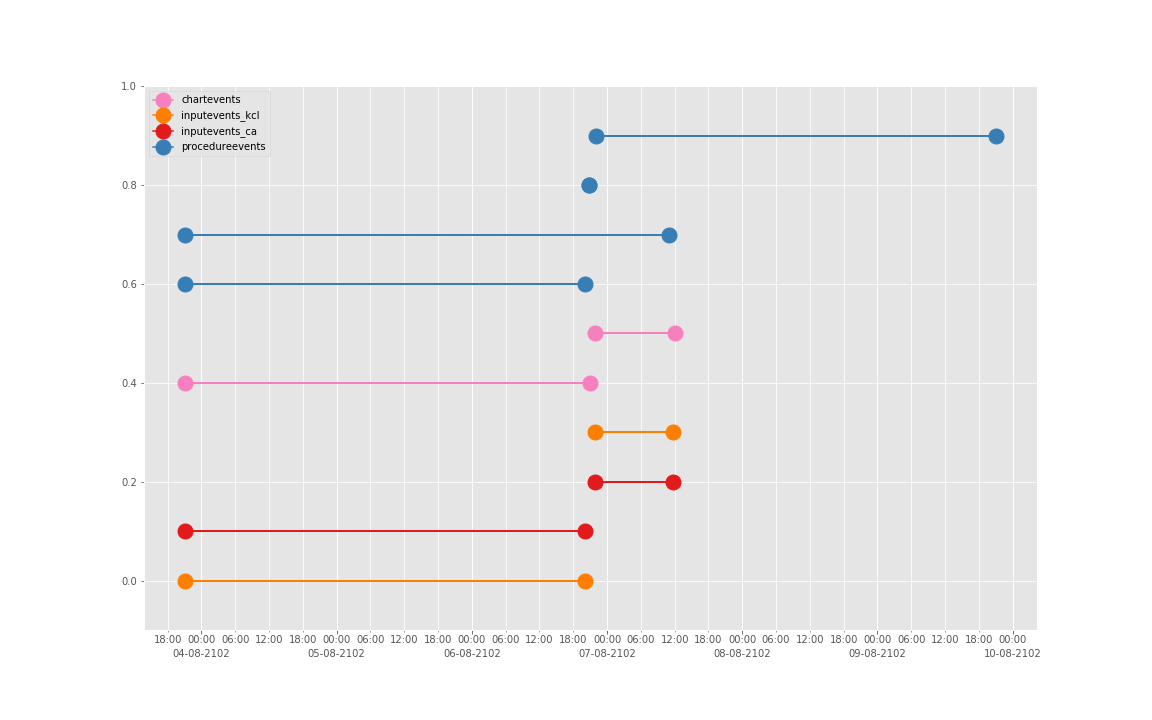
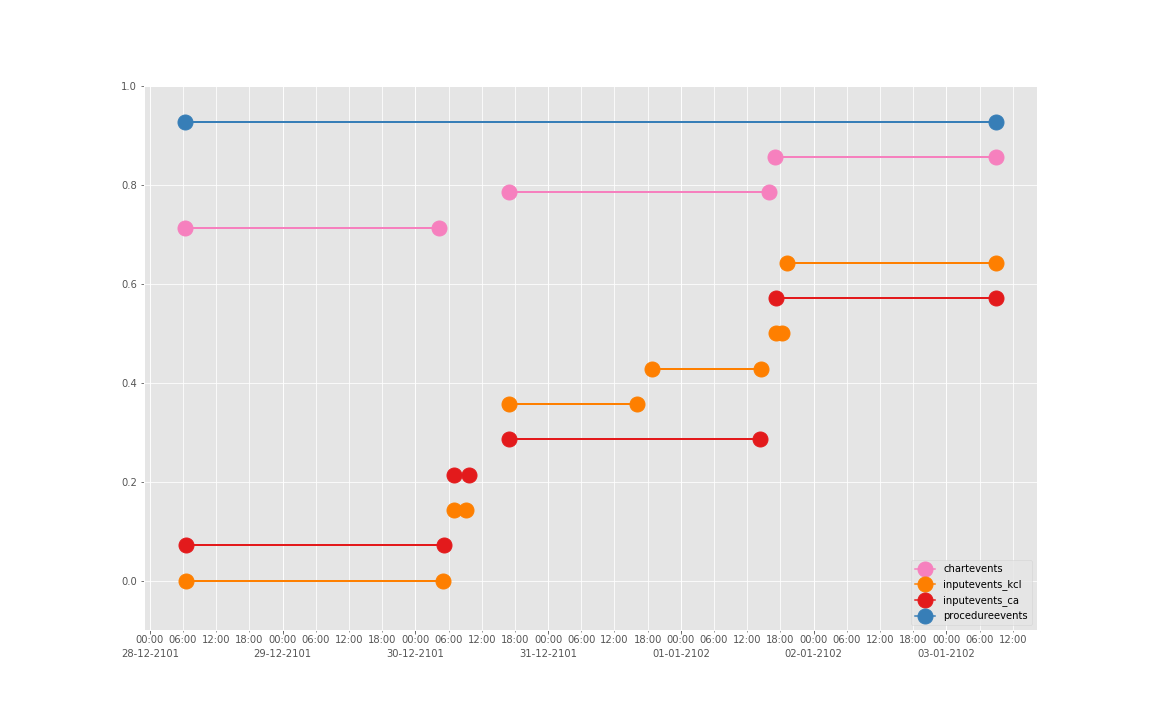
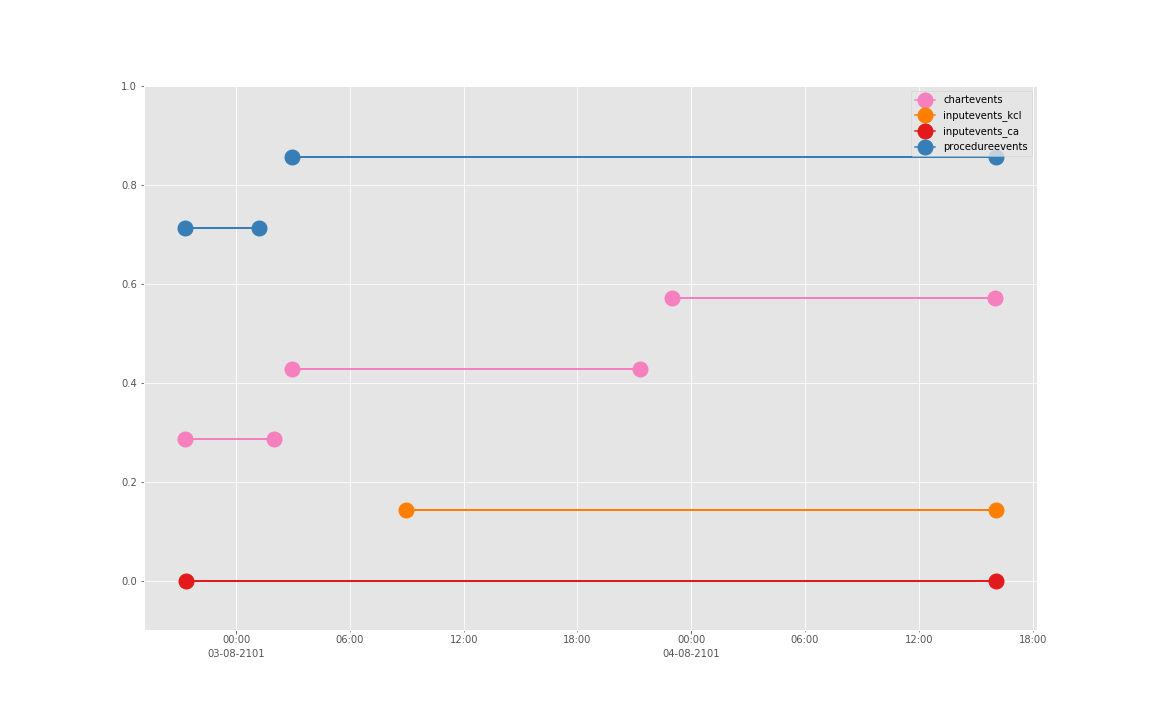
感觉必应随便搞个图下来当封面不错的。再来一次

0.cover

这一篇为什么隔了好几天才出来呢,因为代码的理解难度突然、陡然、猝不及防的上了个 90 度的坡。我看了好几天没看懂。在 RStudio 里光是调代码缩进方便看代码眼睛都要瞎了。结果我的 1080p 屏幕还是无法很好的显示代码,因为一段代码太长了。最后实在没办法还是用 vim 调,顺便学了下 vim 里代码折叠,然后就可以愉快的把那种括号内的东西折叠起来,然后再调代码缩进方便很多,然后代码格式调好了,但是我不是很懂 …… 还得看。

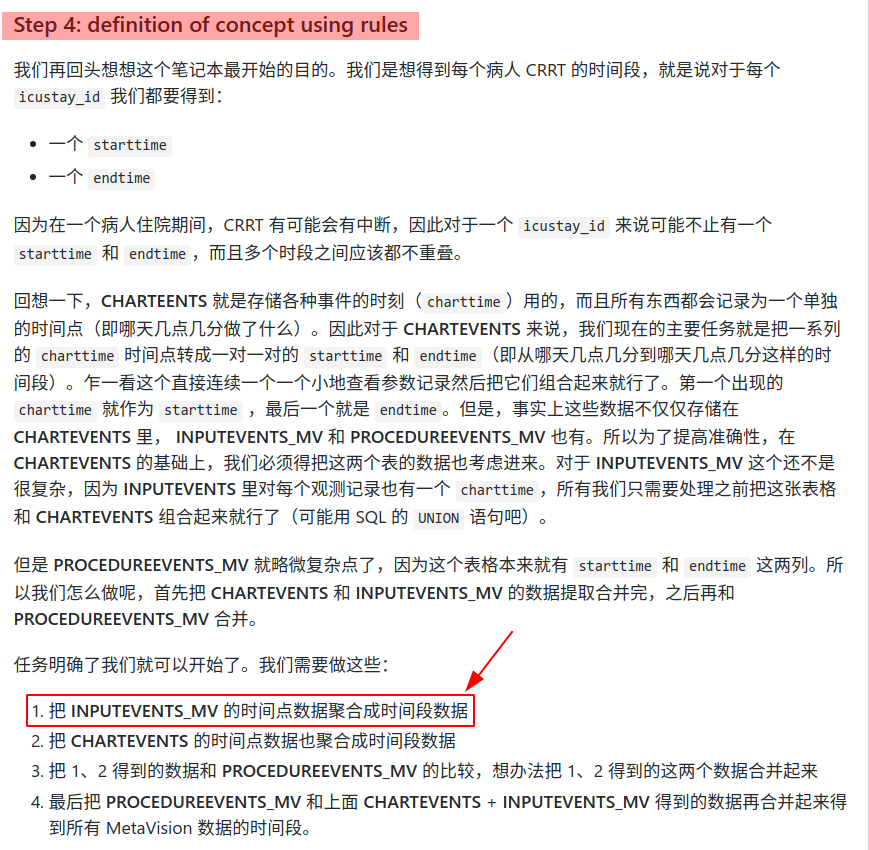
通过前面的两篇,我们用尽心思,千辛万苦,翻雪山过草地,四渡赤水河,用了七七四十九步,历经九九八十一难,终于,finally,at last 可以把同一个事件的多个时间段合并得到一个完整的时间段。但是不要高兴得太早了,还记得我们最开始的时候是 INPUTEVENTS_MVCHARTEVENTSPROCEDUREVENTS_MV 一共三张表格吗?现在我们刚刚把 INPUTEVENTS_MV 表格处理完,而已。我们在上一篇 Step 4 定下的步骤还记得吗?

1.WhereWeR

有没有很惊喜?有没有很意外?我们做了这么就其实才做完 Step 4 的第 1 条哈哈哈哈。

好吧,乖乖继续按流程走吧。


Convert CHARTEVENTS into durations

(我已经连这应该是几级标题都搞不清楚了)

INPUTEVENTS_MV 处理好了,轮到下一个 CHARTEVENTS 。我们直接复用之前写好的代码就行了(一样的作为示例我们只看一个病人的):

  1
  2
  3
  4
  5
  6
  7
  8
  9
 10
 11
 12
 13
 14
 15
 16
 17
 18
 19
 20
 21
 22
 23
 24
 25
 26
 27
 28
 29
 30
 31
 32
 33
 34
 35
 36
 37
 38
 39
 40
 41
 42
 43
 44
 45
 46
 47
 48
 49
 50
 51
 52
 53
 54
 55
 56
 57
 58
 59
 60
 61
 62
 63
 64
 65
 66
 67
 68
 69
 70
 71
 72
 73
 74
 75
 76
 77
 78
 79
 80
 81
 82
 83
 84
 85
 86
 87
 88
 89
 90
 91
 92
 93
 94
 95
 96
 97
 98
 99
100
101
102
103
104
105
106
107
108
109
110
111
112
113
114
115
116
117
118
119
120
121
122
123
124
125
126
127
128
129
130
131
132
133
134
135
136
137
138
139
140
141
142
143
WITH crrt_settings AS
  (
  SELECT ce.icustay_id, ce.charttime
  , MAX(CASE WHEN ce.itemid IN
            (
            224149, -- Access Pressure
            224144, -- Blood Flow (ml/min)
            228004, -- Citrate (ACD-A)
            225183, -- Current Goal
            225977, -- Dialysate Fluid
            224154, -- Dialysate Rate
            224151, -- Effluent Pressure
            224150, -- Filter Pressure
            225958, -- Heparin Concentration (units/mL)
            224145, -- Heparin Dose (per hour)
            224191, -- Hourly Patient Fluid Removal
            228005, -- PBP (Prefilter) Replacement Rate
            228006, -- Post Filter Replacement Rate
            225976, -- Replacement Fluid
            224153, -- Replacement Rate
            224152, -- Return Pressure
            226457  -- Ultrafiltrate Output
            )
        THEN 1 ELSE 0 END) AS RRT
    -- Below indicates that a new instance of CRRT has started
  , MAX(CASE
    -- System Integrity
        WHEN ce.itemid = 224146 AND
             value IN ('New Filter','Reinitiated')
        THEN 1 ELSE 0 END) AS RRT_start
    -- Below indicates that the current instance of CRRT has ended
  , MAX(CASE
    -- System Integrity
        WHEN
          ce.itemid = 224146 AND
          value IN ('Discontinued','Recirculating') THEN 1
        WHEN ce.itemid = 225956
        THEN 1 ELSE 0 END ) AS RRT_end
  FROM chartevents ce
  WHERE ce.itemid IN
    (
      -- MetaVision ITEMIDs
      -- Below require special handling
      224146, -- System Integrity
      225956,  -- Reason for CRRT Filter Change

      -- Below are settings which indicate CRRT is started/continuing
      224149, -- Access Pressure
      224144, -- Blood Flow (ml/min)
      228004, -- Citrate (ACD-A)
      225183, -- Current Goal
      225977, -- Dialysate Fluid
      224154, -- Dialysate Rate
      224151, -- Effluent Pressure
      224150, -- Filter Pressure
      225958, -- Heparin Concentration (units/mL)
      224145, -- Heparin Dose (per hour)
      224191, -- Hourly Patient Fluid Removal
      228005, -- PBP (Prefilter) Replacement Rate
      228006, -- Post Filter Replacement Rate
      225976, -- Replacement Fluid
      224153, -- Replacement Rate
      224152, -- Return Pressure
      226457  -- Ultrafiltrate Output
    )
    AND ce.value is not null
    AND icustay_id = 246866
    GROUP BY icustay_id, charttime
  )

  -- create the durations for each CRRT instance
  SELECT icustay_id
  , ROW_NUMBER() OVER (PARTITION BY icustay_id
                       ORDER BY num) AS num
  , MIN(charttime) AS starttime
  , MAX(charttime) AS endtime
  FROM
  (
  SELECT vd1.*
  -- create a cumulative sum of the instances of new CRRT
  -- this results in a monotonically increasing integer assigned to each CRRT
  , CASE WHEN
      RRT_start = 1 OR RRT=1 OR RRT_end = 1
    THEN SUM(NewCRRT) OVER
      (PARTITION BY icustay_id ORDER BY charttime )
    ELSE null END AS num
  --- now we convert CHARTTIME of CRRT settings into durations
  FROM
    ( -- vd1
      SELECT
      icustay_id
      -- this carries over the previous charttime
      , CASE WHEN RRT=1 THEN
          LAG(CHARTTIME, 1) OVER (PARTITION BY icustay_id, RRT
                                  ORDER BY charttime)
      ELSE null END AS charttime_lag
      , charttime
      , RRT, RRT_start, RRT_end
      -- calculate the time since the last event
      , CASE
      -- non-null iff the current observation indicates settings are present
        WHEN RRT=1 THEN
          CHARTTIME -
            (
              LAG(CHARTTIME, 1) OVER
                  (PARTITION BY icustay_id, RRT
                   ORDER BY charttime)
            )
      ELSE null END AS CRRT_duration

      -- now we determine if the current event is a new instantiation
      , CASE
        WHEN RRT_start = 1 THEN 1
        -- if there is an end flag, we mark any subsequent event as new
        WHEN RRT_end = 1 THEN 0
        -- note the end is *not* a new event, the *subsequent* row is
        -- so here we output 0
        WHEN LAG(RRT_end,1) OVER
          (PARTITION BY icustay_id,
           CASE WHEN RRT=1 OR RRT_end=1 THEN 1
           ELSE 0 END
          ORDER BY charttime
          ) = 1 THEN 1
        -- if there is less than 2 hours between CRRT settings
        -- we do not treat this as a new CRRT event
        WHEN (CHARTTIME - (LAG(CHARTTIME, 1) OVER
                              (PARTITION BY icustay_id,
                               CASE WHEN RRT=1 OR RRT_end=1 THEN 1
                               ELSE 0 END
                              ORDER BY charttime))
              ) <= INTERVAL '2' hour
        THEN 0 ELSE 1 END AS NewCRRT
        -- use the temp table with only settings from chartevents
        FROM crrt_settings
      ) AS vd1
    -- now we can isolate to just rows with settings
    -- (before we had rows with start/end flags)
    -- this removes any null values for NewCRRT
  WHERE RRT_start = 1 OR RRT = 1 OR RRT_end = 1
) AS vd2
GROUP BY icustay_id, num
HAVING MIN(charttime) != MAX(charttime)
ORDER BY icustay_id, num;

(这一段代码的缩进我已经无力了…)
得到:

* num starttime endtime
0 1 Day 11, 23:43 Day 12, 20:00
1 2 Day 12, 22:00 Day 13, 16:30
2 3 Day 13, 18:15 Day 13, 23:00
3 4 Day 14, 15:27 Day 16, 16:00

看看应该没问题,然后就可以去掉那个 AND icustay_id = 246866 来查询所有病人了 (猝不及防地又来了一段 Python,这是为了把查询 CHARTEVENTS 所有病人的查询语句记下来,后面就能直接用了。本来是应该用 R 的,但是我看了一下后面主要是作图。ggplot2 应该画同样的图没问题,但是我懒得查了):

  1
  2
  3
  4
  5
  6
  7
  8
  9
 10
 11
 12
 13
 14
 15
 16
 17
 18
 19
 20
 21
 22
 23
 24
 25
 26
 27
 28
 29
 30
 31
 32
 33
 34
 35
 36
 37
 38
 39
 40
 41
 42
 43
 44
 45
 46
 47
 48
 49
 50
 51
 52
 53
 54
 55
 56
 57
 58
 59
 60
 61
 62
 63
 64
 65
 66
 67
 68
 69
 70
 71
 72
 73
 74
 75
 76
 77
 78
 79
 80
 81
 82
 83
 84
 85
 86
 87
 88
 89
 90
 91
 92
 93
 94
 95
 96
 97
 98
 99
100
101
102
103
104
105
106
107
108
109
110
111
112
113
114
115
116
117
118
119
120
121
122
123
124
125
126
127
128
129
130
131
132
133
134
135
136
137
138
139
140
141
142
143
144
145
146
147
148
149
150
151
152
153
154
155
156
157
# happy with above query
# now remove the one patient constraints
query_chartevents = query_schema + """
WITH crrt_settings AS(
SELECT ce.icustay_id, ce.charttime,
MAX(CASE WHEN ce.itemid IN
      (
        224149, -- Access Pressure
        224144, -- Blood Flow (ml/min)
        228004, -- Citrate (ACD-A)
        225183, -- Current Goal
        225977, -- Dialysate Fluid
        224154, -- Dialysate Rate
        224151, -- Effluent Pressure
        224150, -- Filter Pressure
        225958, -- Heparin Concentration (units/mL)
        224145, -- Heparin Dose (per hour)
        224191, -- Hourly Patient Fluid Removal
        228005, -- PBP (Prefilter) Replacement Rate
        228006, -- Post Filter Replacement Rate
        225976, -- Replacement Fluid
        224153, -- Replacement Rate
        224152, -- Return Pressure
        226457  -- Ultrafiltrate Output
      ) THEN 1 ELSE 0
    END) AS RRT
-- Below indicates that a new instance of CRRT has started
, MAX(
  CASE
    -- System Integrity
    WHEN ce.itemid = 224146 AND value IN ('New Filter','Reinitiated')
      THEN 1 ELSE 0
  END) AS RRT_start
-- Below indicates that the current instance of CRRT has ended
, MAX(
  CASE
    -- System Integrity
    WHEN ce.itemid = 224146 AND value IN ('Discontinued','Recirculating')
      THEN 1
    WHEN ce.itemid = 225956
      THEN 1
  ELSE 0
  END) AS RRT_end
FROM chartevents ce
WHERE ce.itemid IN
  (
    -- MetaVision ITEMIDs
    -- Below require special handling
    224146, -- System Integrity
    225956,  -- Reason fOR CRRT Filter Change

    -- Below are settings which indicate CRRT is started/continuing
    224149, -- Access Pressure
    224144, -- Blood Flow (ml/min)
    228004, -- Citrate (ACD-A)
    225183, -- Current Goal
    225977, -- Dialysate Fluid
    224154, -- Dialysate Rate
    224151, -- Effluent Pressure
    224150, -- Filter Pressure
    225958, -- Heparin Concentration (units/mL)
    224145, -- Heparin Dose (per hour)
    224191, -- Hourly Patient Fluid Removal
    228005, -- PBP (Prefilter) Replacement Rate
    228006, -- Post Filter Replacement Rate
    225976, -- Replacement Fluid
    224153, -- Replacement Rate
    224152, -- Return Pressure
    226457  -- Ultrafiltrate Output
  )
AND ce.value IS NOT null
GROUP BY icustay_id, charttime
)

-- create the durations fOR each CRRT instance
SELECT icustay_id
  , ROW_NUMBER() OVER (PARTITION BY icustay_id ORDER BY num) AS num
  , MIN(charttime) AS starttime
  , MAX(charttime) AS endtime
FROM
(
  SELECT vd1.*
  -- create a cumulative sum of the instances of new CRRT
  -- this results in a monotonically increasing integer assigned to each CRRT
  , CASE WHEN RRT_start = 1 OR RRT=1 OR RRT_end = 1
	THEN SUM(NewCRRT)
      OVER (PARTITION BY icustay_id ORDER BY charttime) ELSE null
	END AS num
  --- now we convert CHARTTIME of CRRT settings into durations
  FROM ( -- vd1
      SELECT
          icustay_id
          -- this carries over the previous charttime
          , CASE
              WHEN RRT=1 THEN
                LAG(CHARTTIME, 1) OVER (PARTITION BY icustay_id, RRT ORDER BY charttime)
              ELSE null
            END AS charttime_lag
          , charttime
          , RRT
          , RRT_start
          , RRT_end
          -- calculate the time since the last event
          , CASE
              -- non-null iff the current observation indicates settings are present
              WHEN RRT=1 THEN
                CHARTTIME -
                (
                  LAG(CHARTTIME, 1) OVER
                  (
                    PARTITION BY icustay_id, RRT
                    ORDER BY charttime
                  )
                )
              ELSE null
            END AS CRRT_duration

          -- now we determine if the current event is a new instantiation
          , CASE
              WHEN RRT_start = 1
                THEN 1
            	-- if there is an end flag, we mark any subsequent event as new
              WHEN RRT_end = 1
                -- note the end is *not* a new event, the *subsequent* row is
                -- so here we output 0
                THEN 0
              WHEN
                LAG(RRT_end,1)
                OVER
                (
                	PARTITION BY icustay_id, CASE WHEN RRT=1 OR RRT_end=1 THEN 1 ELSE 0 END
                	ORDER BY charttime
                ) = 1
 								THEN 1
              -- if there is less than 2 hours between CRRT settings, we do not treat this as a new CRRT event
              WHEN (CHARTTIME - (LAG(CHARTTIME, 1)
              OVER
              (
                PARTITION BY icustay_id, CASE WHEN RRT=1 OR RRT_end=1 THEN 1 ELSE 0  END
                ORDER BY charttime
              ))) <= interval '2' hour
              	THEN 0
            ELSE 1
          END AS NewCRRT
      -- use the temp table with only settings from chartevents
      FROM crrt_settings
  ) AS vd1
  -- now we can isolate to just rows with settings
  -- (befORe we had rows with start/end flags)
  -- this removes any null values fOR NewCRRT
  WHERE
    RRT_start = 1 OR RRT = 1 OR RRT_end = 1
) AS vd2
GROUP BY icustay_id, num
HAVING MIN(charttime) != MAX(charttime)
ORDER BY icustay_id, num;
"""

Extract durations from PROCEDUREEVENTS_MV

PROCEDUREEVENTS_MV 里也有透析的记录。估计你们也忘了前面选的那些了。再列一次我们挑出来 itemid

  • 225802 – Dialysis - CRRT
  • 225803 – Dialysis - CVVHD
  • 225809 – Dialysis - CVVHDF
  • 225955 – Dialysis - SCUF

提取这些数据就很直接了。每个 CRRT 的记录也只记录了一个 starttimestoptime,也就不需要我们再去合并了。

 1
 2
 3
 4
 5
 6
 7
 8
 9
10
11
12
13
14
15
16
17
# extract the durations from PROCEDUREEVENTS_MV
# NOTE: we only look at a single patient as an exemplar
SELECT icustay_id
  , ROW_NUMBER() OVER (
      PARTITION BY icustay_id
      ORDER BY starttime, endtime) AS num
  , starttime, endtime
FROM procedureevents_mv
WHERE itemid IN
(
    225802 -- Dialysis - CRRT
  , 225803 -- Dialysis - CVVHD
  , 225809 -- Dialysis - CVVHDF
  , 225955 -- Dialysis - SCUF
)
AND icustay_id = 246866
ORDER BY icustay_id, num;

得到:

* num starttime endtime
0 1 Day 11, 23:45 Day 12, 20:30
1 2 Day 12, 21:30 Day 13, 23:15
2 3 Day 14, 15:27 Day 16, 16:02

可以看到上面的记录很勤:第 1 行与第 2 行这两条记录之间间隔了一个小时,这是实际中现实中 CRRT 治疗暂停了一个小时的反映。上面的代码没问题的话,现在又要去掉一个病人的限制条件了(和上面一样,这是后面 Python 需要用到的查询语句):

 1
 2
 3
 4
 5
 6
 7
 8
 9
10
11
12
13
14
15
16
17
# happy with above query
# now remove the one patient constraints
query_procedureevents = query_schema + """
SELECT icustay_id
  , ROW_NUMBER() OVER (PARTITION BY icustay_id
                       ORDER BY starttime, endtime) AS num
  , starttime, endtime
FROM procedureevents_mv
WHERE itemid IN
(
    225802 -- Dialysis - CRRT
  , 225803 -- Dialysis - CVVHD
  , 225809 -- Dialysis - CVVHDF
  , 225955 -- Dialysis - SCUF
)
ORDER BY icustay_id, num;
"""

Roundup: data from INPUTEVENTS_MV, CHARTEVENTS, and PROCEDUREEVENTS_MV

好了,现在 3 个表都处理完了。综合一下 3 个结果,但首先我们得把三个结果都存储到一个变量里方便后面比较(这就要用到上一篇最后那个和本篇里上面两个存储在 Python 里的一共 3 个长长的查询语句了。由于我们已经存在 Python 变量了,所以现在只需要套壳 qurey() 就行了。

上面已经有了 query_charteventsquery_procedureevents ,干脆再贴一下 query_inputevents 的,免得回去翻:

 1
 2
 3
 4
 5
 6
 7
 8
 9
10
11
12
13
14
15
16
17
18
19
20
21
22
23
24
25
26
27
28
29
30
31
32
33
34
35
36
37
38
39
40
41
42
43
44
45
46
47
48
49
50
51
52
53
54
55
56
57
58
59
60
query_inputevents = query_schema + """
WITH t1 AS
  (
    SELECT icustay_id
    , CASE WHEN
        itemid = 227525 THEN 'Calcium'
      ELSE 'KCl' END AS label
    , starttime, endtime
    , CASE WHEN LAG(endtime) OVER
        (PARTITION BY icustay_id, itemid ORDER BY starttime, endtime) = starttime
      THEN 0
    ELSE 1 END AS new_event_flag
    , rate, rateuom
    , statusdescription
    FROM inputevents_mv
    WHERE itemid IN
      (
      227525,-- Calcium Gluconate (CRRT)
      227536 -- KCl (CRRT)
      )
    AND statusdescription != 'Rewritten'
  )
  , t2 as
  (
    SELECT
    icustay_id, label
    , starttime, endtime
    , SUM(new_event_flag) OVER
        (PARTITION BY icustay_id, label ORDER BY starttime, endtime)
        AS time_partition
    , rate, rateuom, statusdescription
    FROM t1
  )
  , t3 as
  (
    SELECT
    icustay_id, label
    , starttime, endtime
    , time_partition
    , rate, rateuom, statusdescription
    , ROW_NUMBER() OVER
        (PARTITION BY icustay_id, label, time_partition
          ORDER BY starttime DESC, endtime DESC)
      AS lastrow
    FROM t2
  )
SELECT
icustay_id
, time_partition AS num
, MIN(starttime) AS starttime
, max(endtime) AS endtime
, label
--, MIN(rate) AS rate_min
--, max(rate) AS rate_max
--, MIN(rateuom) AS rateuom
--, MIN(CASE WHEN lastrow = 1 THEN statusdescription ELSE null END) AS statusdescription
FROM t3
GROUP BY icustay_id, label, time_partition
ORDER BY starttime, endtime;
"""

而且这一次也不再是简简单单查询一下看一下数据,而是把结果存下来后面再比较分析)。一样的,先把环境搞起来,载入包:

1
2
3
4
5
6
7
8
import numpy as np
import pandas as pd
import matplotlib.pyplot as plt
import psycopg2
import getpass
from IPython.display import HTML, display
import matplotlib.dates as dates
import matplotlib.lines as mlines

简单设置并且连上数据库:

 1
 2
 3
 4
 5
 6
 7
 8
 9
10
11
%matplotlib inline
plt.style.use("ggplot")

dbname = 'mimic'
user = 'postgres'
schema_name = 'mimiciii'

# ln -s /var/run/postgresql/.s.PGSQL.5432 /tmp/.s.PGSQL.5432
con = psycopg2.connect(dbname="mimic", user="postgres", password=getpass.getpass(prompt='Password:'.format(user)))

query_schema = 'SET search_path to ' + schema_name + ';'

然后得到那三个数据:

1
2
3
4
5
6
7
8
print("Durations from INPUTEVENTS...")
ie = pd.read_sql_query(query_inputevents,con)

print("Durations from CHARTEVENTS...")
ce = pd.read_sql_query(query_chartevents,con)

print("Durations from PROCEDUREEVENTS...")
pe = pd.read_sql_query(query_procedureevents,con)

进行下一步之前我们先看看得到的这三个数据到底长什么样子:

1
2
print("First 5 lines of ie...")
ie.head()

表格 ie

* icustay_id num starttime endtime label
0 205508 1 2101-07-09 18:10:00 2101-07-13 15:44:00 Calcium
1 280550 1 2101-08-02 21:20:00 2101-08-04 16:05:00 Calcium
2 280550 1 2101-08-03 08:56:00 2101-08-04 16:05:00 KCl
3 217315 1 2101-09-21 01:00:00 2101-09-21 09:00:00 Calcium
4 217315 2 2101-09-21 11:00:00 2101-09-27 11:00:00 Calcium

表格 ce

1
2
print("First 5 lines of ce...")
ce.head()
* icustay_id num starttime endtime
0 200347 1 2116-06-10 15:00:00 2116-06-11 01:00:00
1 200347 2 2116-06-11 04:20:00 2116-06-11 18:00:00
2 200347 3 2116-06-11 19:00:00 2116-06-12 08:00:00
3 200347 4 2116-06-12 10:02:00 2116-06-13 10:26:00
4 200699 1 2105-04-30 00:19:00 2105-04-30 08:00:00

表格 pe:

1
2
print("First 5 lines of pe...")
pe.head()
* icustay_id num starttime endtime
0 200347 1 2116-06-10 15:00:00 2116-06-11 00:07:00
1 200347 2 2116-06-11 04:20:00 2116-06-12 07:27:00
2 200347 3 2116-06-12 10:00:00 2116-06-12 12:22:00
3 200347 4 2116-06-12 13:15:00 2116-06-13 10:29:00
4 200699 1 2105-04-30 00:19:00 2105-04-30 09:00:00

可以看到表格除了 ie 有一列 lable 用来表示使用的是钙还是钾之外,表格剩余 4 列都是 icustay_idnumstarttimeendtime,其中 num 用来区分同一个人多次治疗。

Compare durations

现在呢,就把三个数据合起来。而且为了让合并起来的数据知道是来自于这三个表格中的哪个,我们还要加上一列 source。对于 ie 我们还得区分这是 KCl 还是 Ca:

 1
 2
 3
 4
 5
 6
 7
 8
 9
10
11
12
13
14
15
16
17
def display_df(df):
    col = [x for x in df.columns if x != 'icustay_id']
    df_tmp = df[col].copy()
    for c in df_tmp.columns:
        if '[ns]' in str(df_tmp[c].dtype):
            df_tmp[c] = df_tmp[c].dt.strftime('Day %d, %H:%M')
    
    display(HTML(df_tmp.to_html().replace('NaN', '')))

# compare the above durations
ce['source'] = 'chartevents'
ie['source'] = 'inputevents_kcl'
ie.loc[ie['label']=='Calcium','source'] = 'inputevents_ca' 
pe['source'] = 'procedureevents'
df = pd.concat([ie[['icustay_id','num','starttime','endtime','source']], ce, pe])

df.head()

然后合并后数据长这样:

* icustay_id num starttime endtime source
0 205508 1 2101-07-09 18:10:00 2101-07-13 15:44:00 inputevents_ca
1 280550 1 2101-08-02 21:20:00 2101-08-04 16:05:00 inputevents_ca
2 280550 1 2101-08-03 08:56:00 2101-08-04 16:05:00 inputevents_kcl
3 217315 1 2101-09-21 01:00:00 2101-09-21 09:00:00 inputevents_ca
4 217315 2 2101-09-21 11:00:00 2101-09-27 11:00:00 inputevents_ca

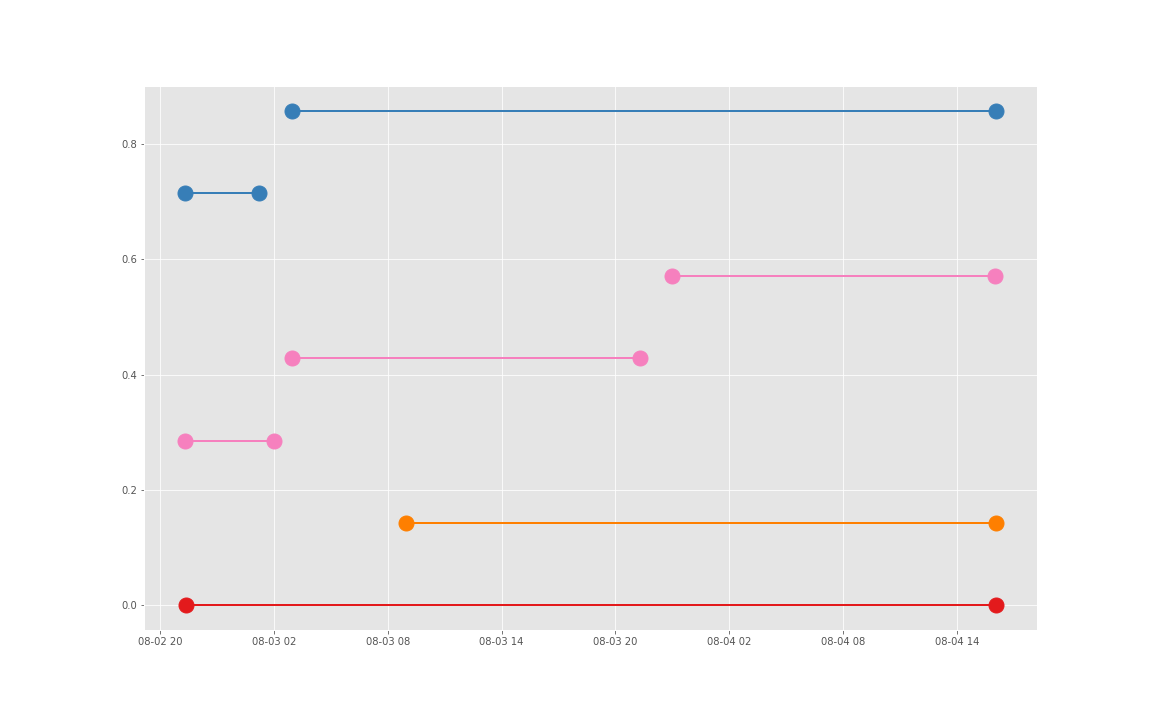
然后单独拎出一个病人的数据,来看一下这个个不同来源的数据之间是否相互重叠:

1
2
3
4
iid = 205508

idxDisplay = df['icustay_id'] == iid
display_df(df.loc[idxDisplay, :])

得到:

* num starttime endtime source
0 1 Day 09, 18:10 Day 13, 15:44 inputevents_ca
136 1 Day 09, 18:00 Day 12, 15:15 chartevents
137 2 Day 12, 16:02 Day 12, 19:01 chartevents
138 3 Day 12, 21:00 Day 13, 14:03 chartevents
147 1 Day 09, 18:00 Day 13, 15:04 procedureevents

看表还不够直观,我们画图:

 1
 2
 3
 4
 5
 6
 7
 8
 9
10
11
12
13
14
15
16
17
18
19
20
21
22
23
24
25
26
27
28
29
30
31
32
33
34
35
36
37
38
# set a color palette
col_dict = {'chartevents': [247,129,191],
           'inputevents_kcl': [255,127,0],
           'inputevents_ca': [228,26,28],
           'procedureevents': [55,126,184]}

for c in col_dict:
    col_dict[c] = [x/256.0 for x in col_dict[c]]


fig, ax = plt.subplots(figsize=[16,10])
m = 0.
M = np.sum(idxDisplay)

# dummy plots for legend
legend_handle = list()
for c in col_dict:
    legend_handle.append(mlines.Line2D([], [], color=col_dict[c], marker='o',
                              markersize=15, label=c))

for row in df.loc[idxDisplay,:].iterrows():
    # row is a tuple: [index, actual_data], so we use row[1]
    plt.plot([row[1]['starttime'].to_pydatetime(), row[1]['endtime'].to_pydatetime()], [0+m/M,0+m/M],
            'o-',color=col_dict[row[1]['source']],
            markersize=15, linewidth=2)
    m=m+1
    
ax.xaxis.set_minor_locator(dates.HourLocator(byhour=[0,12],interval=1))
ax.xaxis.set_minor_formatter(dates.DateFormatter('%H:%M'))
ax.xaxis.grid(True, which="minor")
ax.xaxis.set_major_locator(dates.DayLocator(interval=1))
ax.xaxis.set_major_formatter(dates.DateFormatter('\n%d\n%a'))

ax.set_ylim([-0.1,1.0])

plt.legend(handles=legend_handle,loc='best')
plt.savefig('0-crrt_' + str(iid) + '.png')
plt.show()

得到图:

2.data.overlap.png

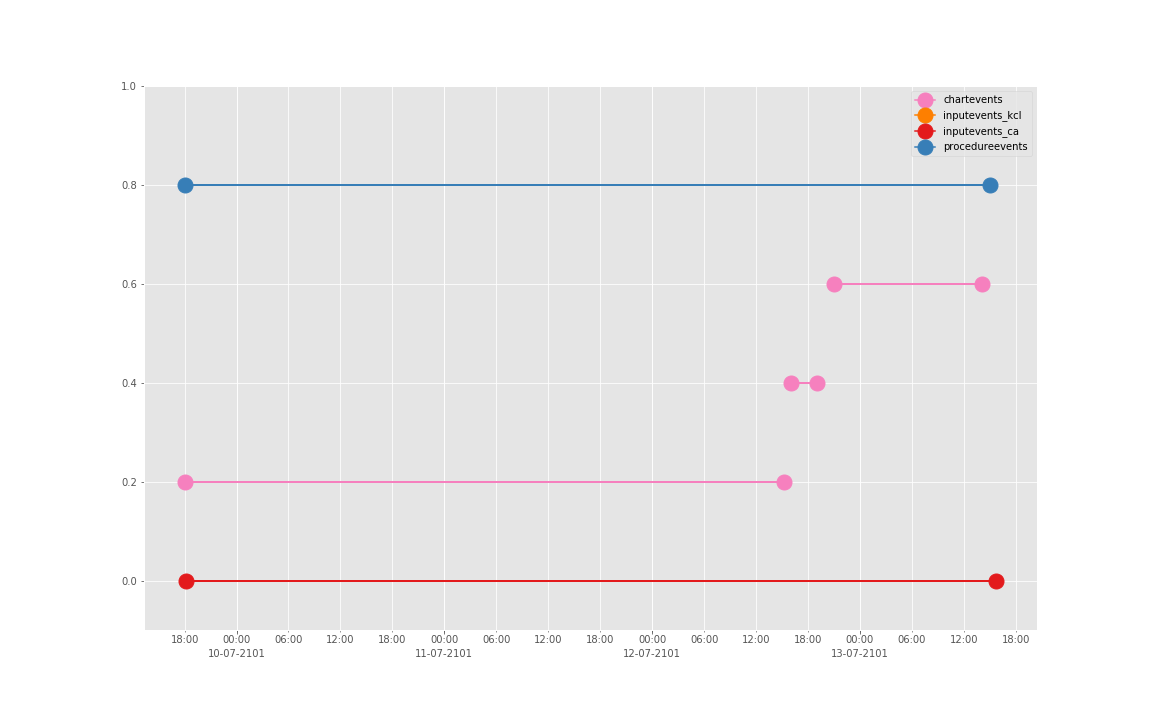
可以发现三个数据基本上对于起止时间记录相差不大,差别仅仅在于数据是否是分段记录的(治疗间的暂停如何记录和定义的问题)。

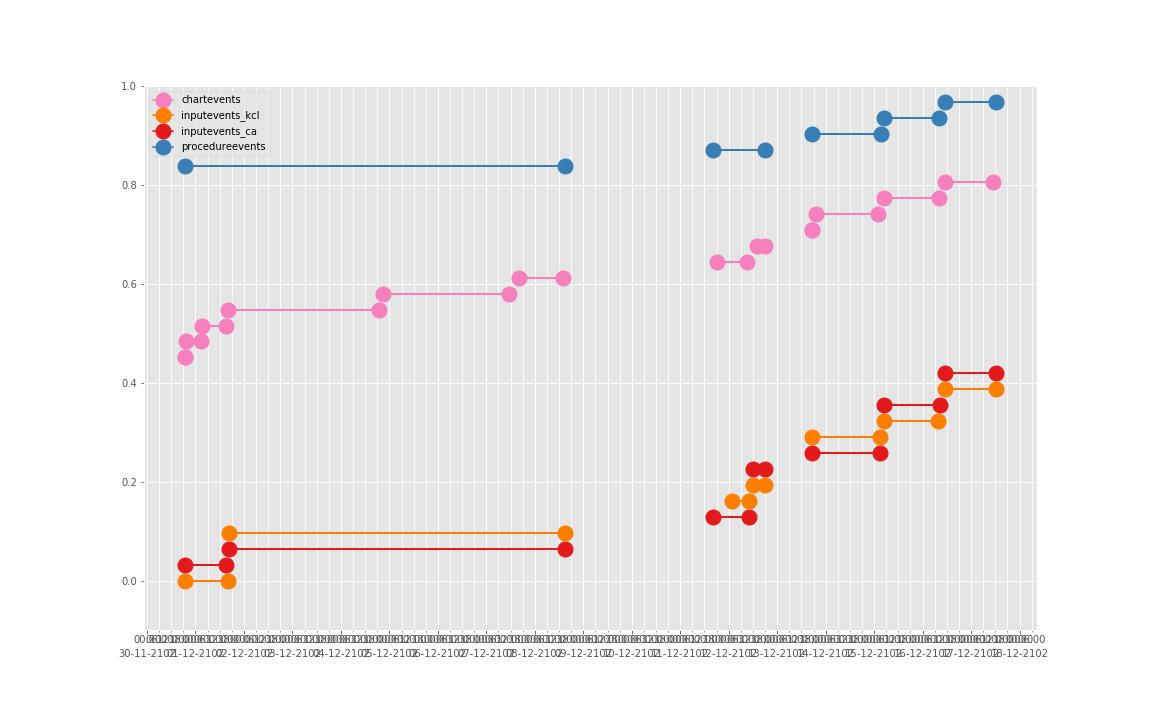
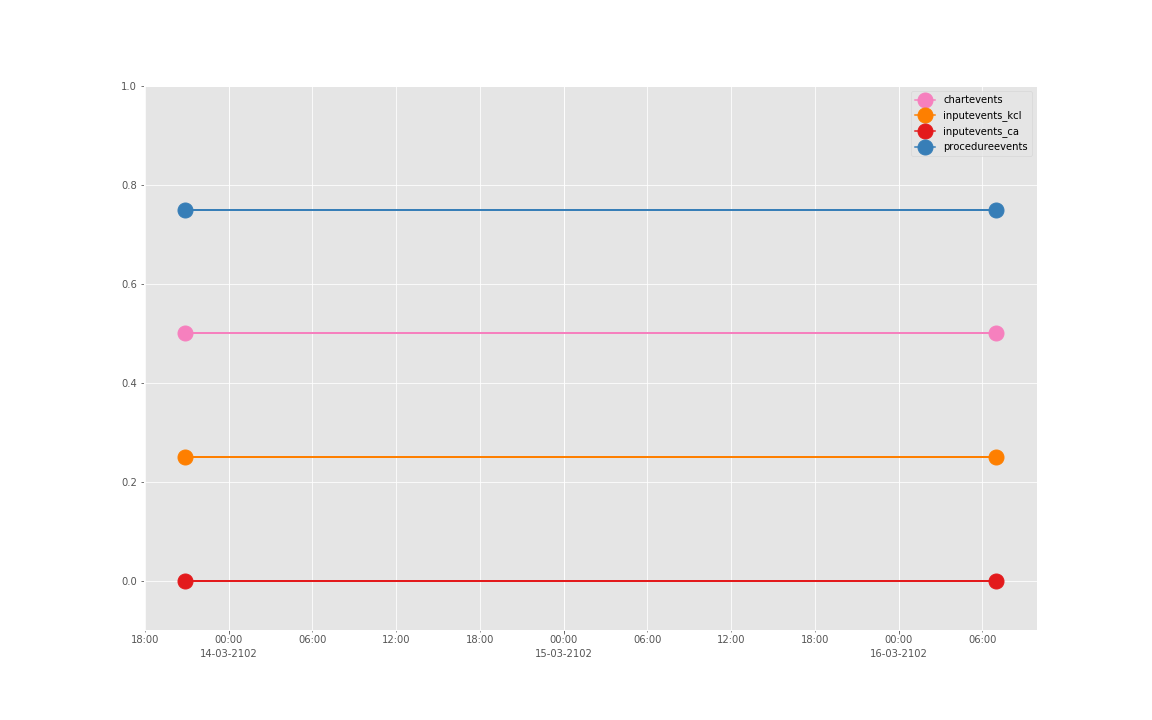
这是一个病人的数据。我们现在来直接看 10 个:

 1
 2
 3
 4
 5
 6
 7
 8
 9
10
11
12
13
14
15
16
17
18
19
20
21
22
23
24
25
26
27
28
29
30
31
32
33
34
35
36
37
38
39
40
41
42
43
44
45
46
47
48
49
50
51
52
53
54
55
56
57
# print out the above for 10 examples

# compare the above durations
ce['source'] = 'chartevents'
ie['source'] = 'inputevents_kcl'
ie.loc[ie['label']=='Calcium','source'] = 'inputevents_ca' 
pe['source'] = 'procedureevents'
df = pd.concat([ie[['icustay_id','num','starttime','endtime','source']], ce, pe])

for iid in np.sort(df.icustay_id.unique()[0:10]):
    iid = int(iid)
    # how many PROCEDUREEVENTS_MV dialysis events encapsulate CHARTEVENTS/INPUTEVENTS_MV?
    # vice-versa?
    idxDisplay = df['icustay_id'] == iid
    
    # no need to display here
    #display_df(df.loc[idxDisplay, :])
    
    # 2) how many have no overlap whatsoever?
    col_dict = {'chartevents': [247,129,191],
               'inputevents_kcl': [255,127,0],
               'inputevents_ca': [228,26,28],
               'procedureevents': [55,126,184]}

    for c in col_dict:
        col_dict[c] = [x/256.0 for x in col_dict[c]]


    fig, ax = plt.subplots(figsize=[16,10])
    m = 0.
    M = np.sum(idxDisplay)

    # dummy plots for legend
    legend_handle = list()
    for c in col_dict:
        legend_handle.append(mlines.Line2D([], [], color=col_dict[c], marker='o',
                                  markersize=15, label=c))

    for row in df.loc[idxDisplay,:].iterrows():
        # row is a tuple: [index, actual_data], so we use row[1]
        plt.plot([row[1]['starttime'].to_pydatetime(), row[1]['endtime'].to_pydatetime()], [0+m/M,0+m/M],
                'o-',color=col_dict[row[1]['source']],
                markersize=15, linewidth=2)
        m=m+1

    ax.xaxis.set_minor_locator(dates.HourLocator(byhour=[0,6,12,18],interval=1))
    ax.xaxis.set_minor_formatter(dates.DateFormatter('%H:%M'))
    ax.xaxis.grid(True, which="minor")
    ax.xaxis.set_major_locator(dates.DayLocator(interval=1))
    ax.xaxis.set_major_formatter(dates.DateFormatter('\n%d-%m-%Y'))

    ax.set_ylim([-0.1,1.0])

    plt.legend(handles=legend_handle,loc='best')
    
    # if you want to save the figures, uncomment the line below
    #plt.savefig('crrt_' + str(iid) + '.png')

依次得到 10 个人的图:

crrt_202837

crrt_203641

crrt_205508

crrt_206253

crrt_214522

crrt_217315

crrt_257445

crrt_261439

crrt_265724

crrt_280550

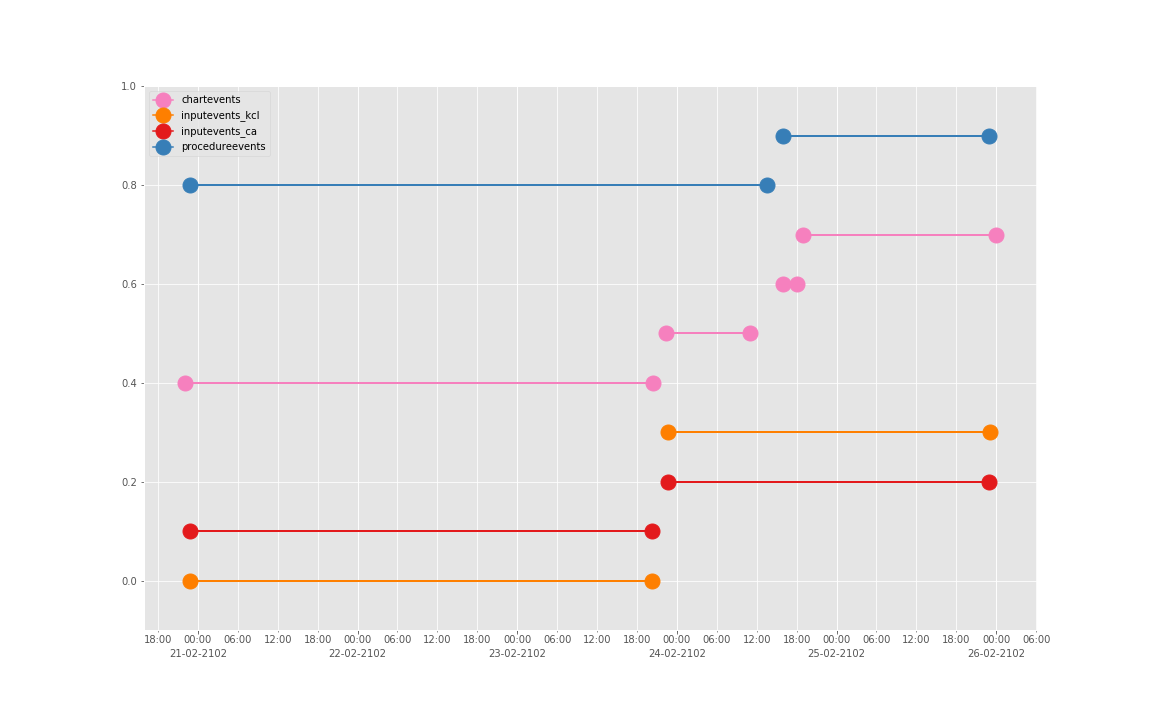
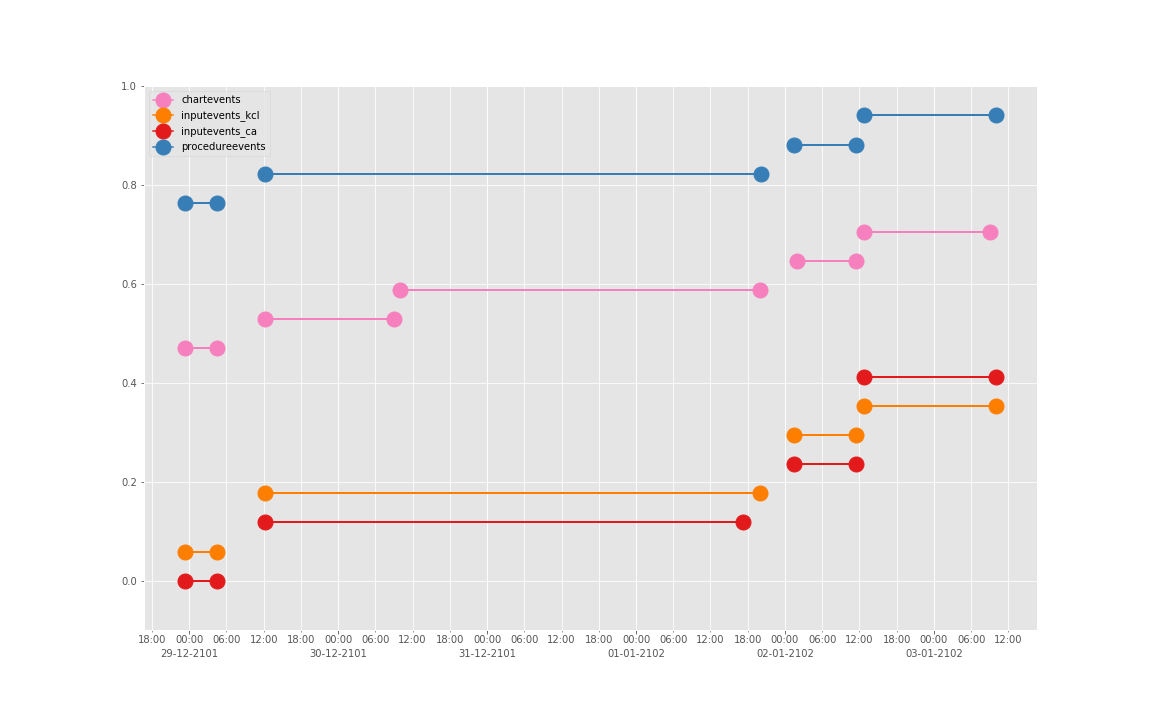
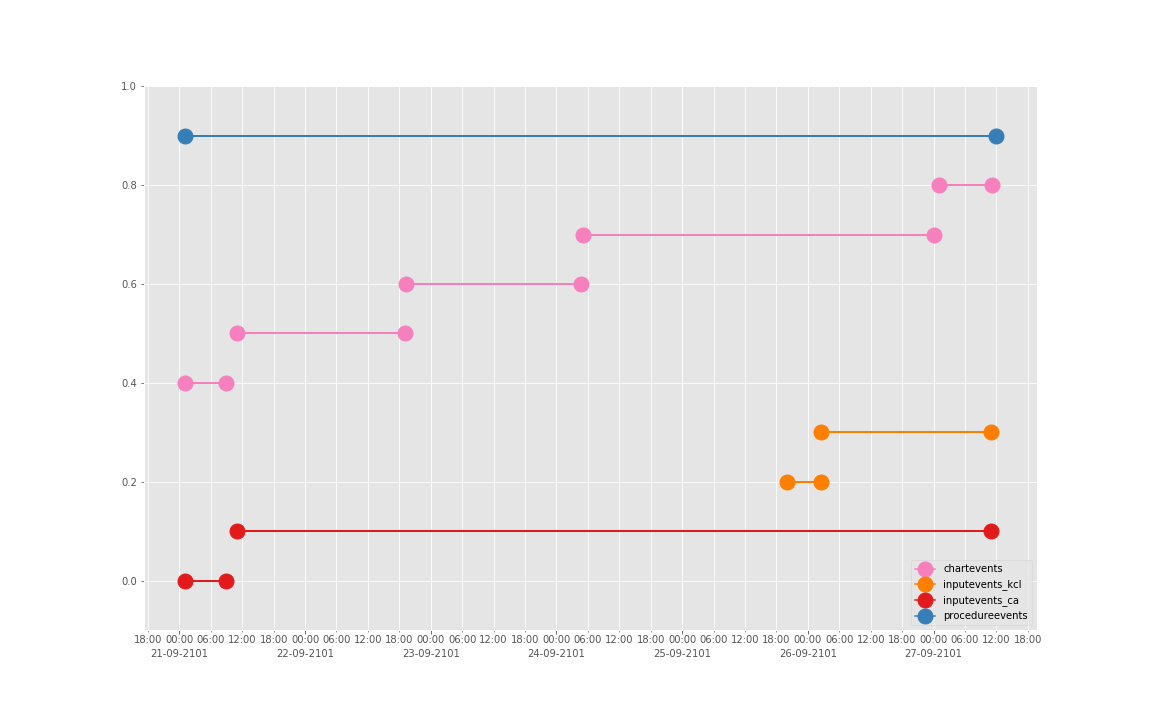
看了这些图,好像 INPUTEVENTSPROCEDUREEVENTS_MV 里的数据对于 CHARTEVENTS 来说基本上是冗余的。而且,CHARTEVENTS 的记录似乎似乎更好地反映了 CRRT 治疗过程中因为输液管阻塞和治疗暂停等导致的记录中断。综合一下,我们其实对于反映 CRRT 的治疗时间来说,仅仅用 CHARTEVENTS 的数据就够了。concepts/durations/crrt-durations.sql 这里放的查询脚本包含了最终加入 CareVue 的 itemid(乖乖,我们到这里才算真的做完了一半,CareVue 的还没开始)。查找这些数据的方法和这个记事本讲的方法一样。


最难一根骨头终于啃完了。但是其实代码还不是特别熟悉,还要仔细看。然后后面再看哪一个再说。

发觉还是要好好学一下 Python 分析数据了,因为我发现好像 Python 查询 postgreSQL 好像速度要快很多,虽然我还是不算很喜欢 Jupyter-Notebook 这种工作方式。